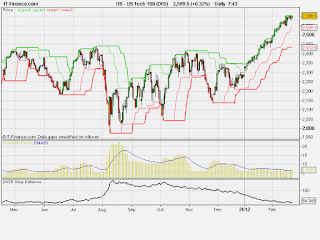
In the first part of the chart, showing several months of 2011, you can see a general lack of direction, particularly from August onwards, coupled with the higher levels of volatility. Trying to trade this in a trend following fashion would have resulted in repeated exits due to the whipsawing nature of the market. This highlights a non-trending, volatile market - the worst combination for trend followers.
However you can see that since the beginning on 2012, it is almost as if someone has flipped a switch - a meaningful trend appeared, and the volatility has reduced right down. This therefore is a trending, stable market - ideal for trend followers as the volatility will make it highly unlikely for traders to be whipsawed out of a position.
The problem that trend followers have is that, with each signal, you never know whether a trend will take off. We do not try to predict - we simply act on the signals given. This in a nutshell explains how trend followers did very well in the 2008 - 2010 period, and not so well last year, and highlights the psychological barriers you need to overcome to be in a position to take the signals as and when they are presented to you.


No comments:
Post a Comment