I have a number of specific rules which govern the type of price set ups I look for. To help me identify these I have developed and refined scans over a number of years.
My original scan codes only identified price breakouts at the point they occurred. This meant I had to be in front of the screen and see these pop up in real time so that I could get in close to the breakout level. I've now been able to re-code these so I can identify these set ups prior to breakout.
This enables me to enter stop orders on a Good Til Cancelled basis on the market open.
The scans significantly leverage my time. As I am looking for a price set up with a number of specific characteristics, I am able to scour stocks across a number of countries to identify those set ups.
Of those which do meet my criteria, I would estimate that 60% - 70% of those stocks which get onto my watchlist I don't end up trading - this can be due to proximity of earnings releases, a volatility spike, or price falling away from the identified breakout level and never triggering an entry. There can also be others which based on the chart may be appealing, but are unable to be traded, or the width of the spread may be prohibitive.
Out of those trades I do end up taking, my historical win rate is just over 30%.
Below are a couple of interesting set ups I picked up when running my scans last night which, should the other conditions be met, I would look to trade on a price breakout. You will see that these all have similar characteristics:
- Price is consolidating just below the 20 day high, or at least within the top half of the channel between the 20 day high and 20 day low;
- The Volatility Factor indicator reading is below its own 20 day moving average;
- Looking at the price channels themselves, there is a pattern starting to form of higher highs and higher lows, or alternatively a prolonged period of consolidation; and
- The level of the thick green line (the 20 day high) has been consistent for a few days (denoting no minor or failed breakouts).
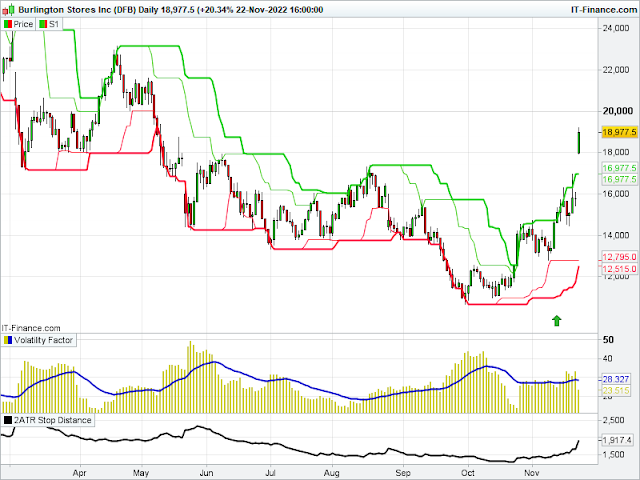
And here are the charts of some positions recently opened (the days of entry are highlighted with the green arrow). These also exhibit the same characteristics prior to price breaking out:
This German stock broke out near the end of the day when earnings were released before the market open:
In recent years, for diversification I've added some FX pairs and commodities to what I look to trade. After profiting on the short side earlier in the year, Cable recently gave a long signal which I took:
Within the setups identified, there are always a few which I could have taken, but didn't for some reason. Here are a couple:
This one I was unable to trade in my trading platform, which was frustrating...
And this US stock was on my watchlist but I did not take the trade. This was due to an earnings release yesterday, and I have a rule that I cannot take a position in a stock when the breakout occurs within a set number of days of an earnings release. In this case price broke out within that time period, so I did not take the entry:
Of course, with the set ups I have identified there is no way of knowing if they will trigger an entry, or whether the positions I have taken will generate a profit or a loss - my stop methodology will determine when I get out of those positions.


No comments:
Post a Comment